The app is served and available here thanks to the Huma-Num RStudio server.
Modules
For now, the app contains two modules
General: It describes a dataset documenting many floodplain cities (\(N\)=993) around the world. The descriptors are documented in the app upon choosing a variable.
OSM: It shows a set of selected cities (for now \(N_A\)=length(glourbapp::cities)), the study area considered for each floodplain city, as well as a number of OpenStreetMap data items falling into these areas and relative to floodplain urbanization.
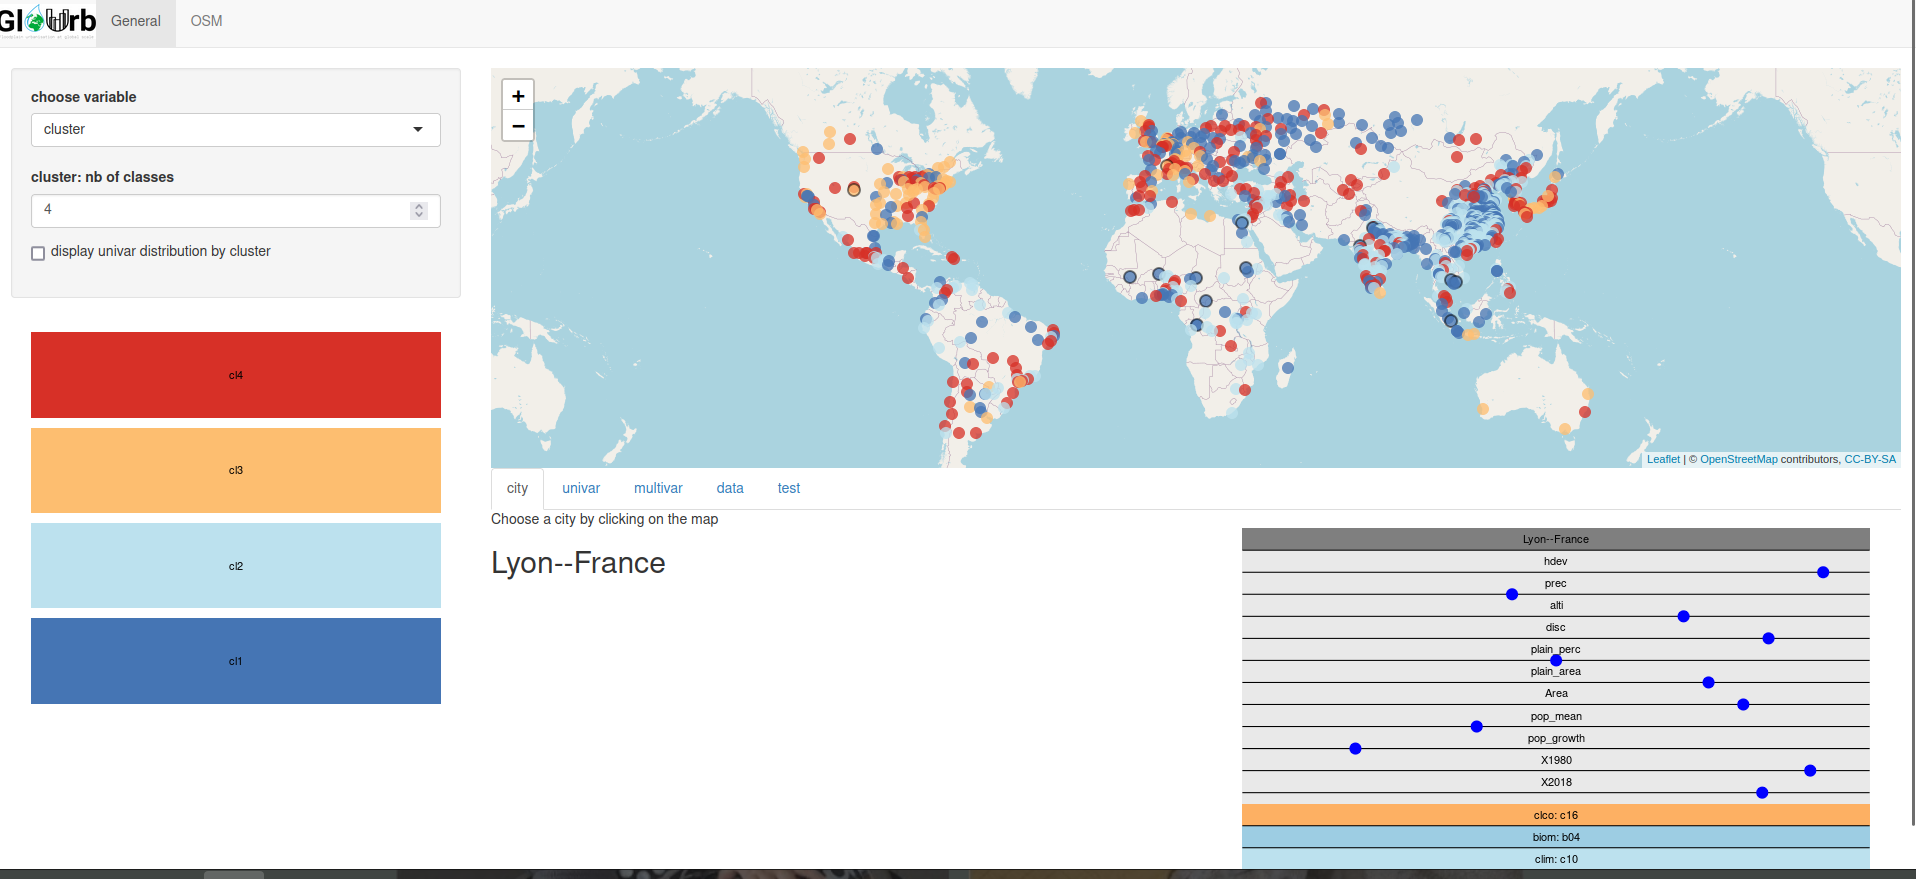
General
The variable chosen impacts the colorscale as described in the bottom-left part of the screen (with 10 categories corresponding to deciles for quantitative variables) for
the map,
the univar plot
the multivar plot
The user might also choose a variable called cluster, which corresponds to the result of a hierarchical clustering of floodplain cities based on all quantitative description variables (normalized by using ranks instead or raw values). The user might choose the number of classes.
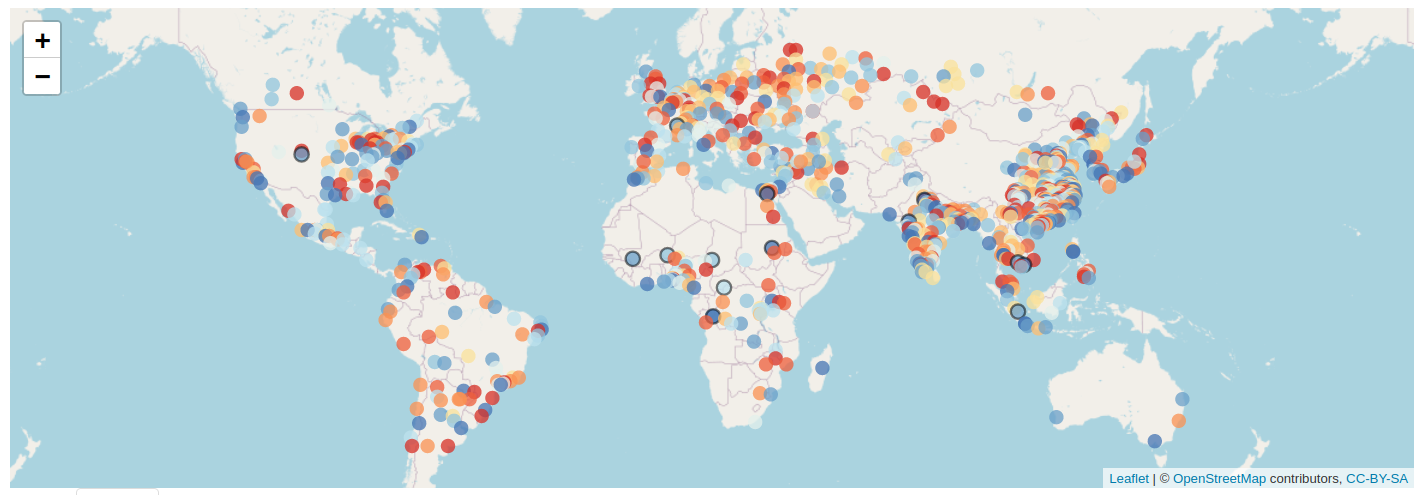
Map
The map is clickable: you can choose a particular floodplain city by clicking on it. By clicking on it you will get its name as a popup, and will update the city plot. Markers with a black outline correspond to the floodplain cities that are part of the selected sub-sample A. More floodplain cities will be added to this group, so that we should have \(N_A\approx 300\) by the end of the project.
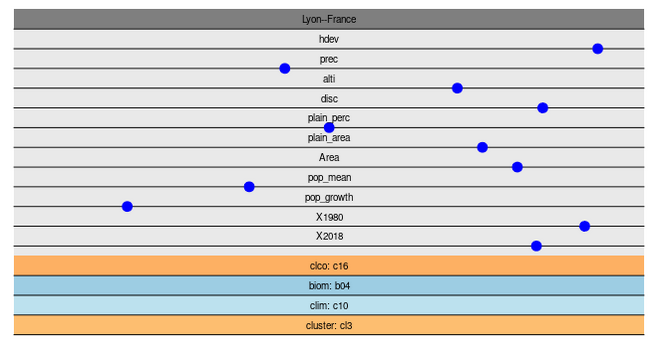
City plot
The city description plot, here for Lyon
The city plot displays how the city compares to all others, variable by variable. For quantitative descritors, the cursor corresponds to the considered floodplain city’s rank among all \(N_0\) cities considered: lowest on the left, highest on the right)
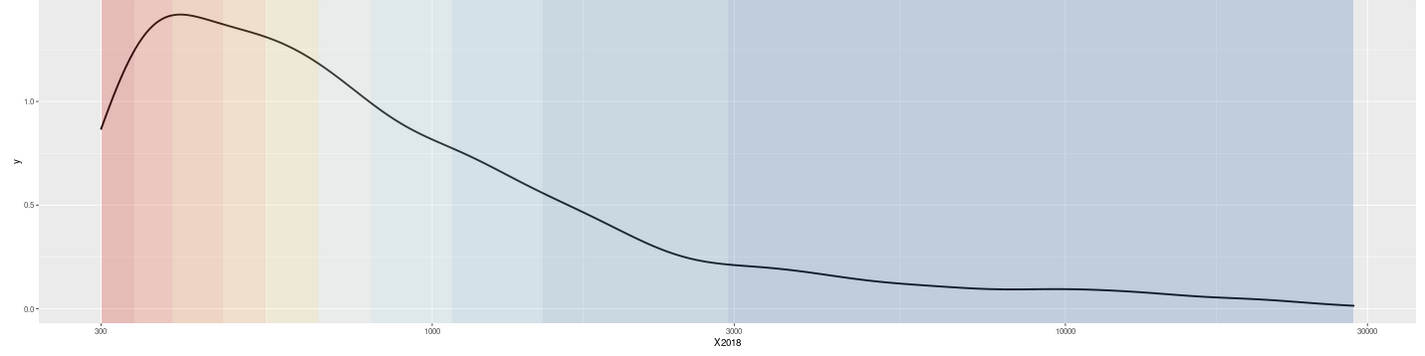
Univar plot
univar plot, here for descriptor X2018
The univar plot shows the distribution of selected variable (density for quantitative variables, proportion for categorical variables).
Multivar plot
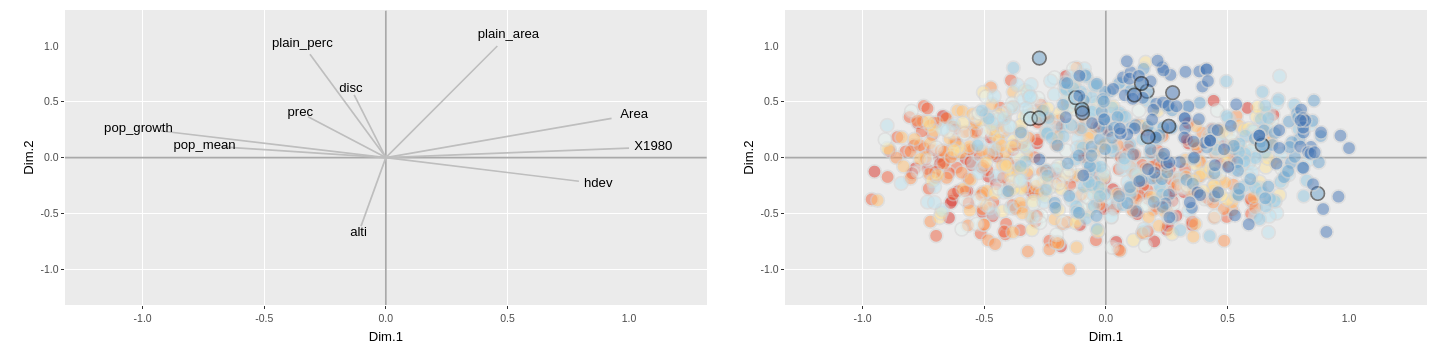
the multivar plot, here with colorscale corresponding to descriptor X2018
The multivar plot shows the first factorial map based on quantitative descriptors of all \(N_0\) floodplain cities. The Principal Component Analysis was run based on all quantitative description variables (normalized by using ranks instead or raw values).
OSM
This module shows the study areas corresponding to all floodplain cities listed as part of sample A.
All items falling into these areas and corresponding to particular OSM key-values which we considered relevant to the study of urbanized floodplains were retrieved. Here are the ones we considered for now:
knitr::kable(glosmurb::tib_key_value)
key
value
group
geom
color
priority
landuse
farmland
food production
osm_polygons
#f9e79f
1
landuse
meadow
food production
osm_polygons
#f9ebea
1
landuse
allotments
food production
osm_polygons
#cd6155
1
landuse
orchard
food production
osm_polygons
#d7bde2
1
landuse
plant_nursery
food production
osm_polygons
#f5b7b1
1
landuse
vineyard
food production
osm_polygons
#9b59b6
1
landuse
aquaculture
food production
osm_polygons
#5d6d7e
1
man_made
groyne
engineering
osm_lines
#fbfcfc
1
man_made
dyke
engineering
osm_lines
#808b96
1
waterway
dam
engineering
osm_lines
#566573
1
man_made
embankment
engineering
osm_lines
#abb2b9
1
seamark:type
gate
engineering
osm_points
#e74c3c
1
man_made
bridge
engineering
osm_polygons
#cb4335
1
man_made
wastewater_plant
engineering
osm_polygons
#9a7d0a
1
landuse
quarry
engineering
osm_polygons
#a04000
1
landuse
port
engineering
osm_polygons
#95a5a6
1
landuse
basin
engineering
osm_polygons
#2874a6
1
power
plant
engineering
osm_polygons
#FF0000
1
amenity
drinking_water
equipment
osm_points
#3498db
1
amenity
bench
equipment
osm_points
#4a235a
1
amenity
waste_basket
equipment
osm_points
#154360
1
leisure
picnic_table
equipment
osm_points
#0e6251
1
tourism
viewpoint
equipment
osm_points
#6e2c00
1
leisure
swimming_area
entertainment
osm_polygons
#aed6f1
1
leisure
dog_park
entertainment
osm_polygons
#9c640c
1
leisure
fishing
entertainment
osm_polygons
#1f618d
1
leisure
playground
entertainment
osm_polygons
#f8c471
1
leisure
beach_resort
entertainment
osm_polygons
#f7dc6f
1
leisure
resort
entertainment
osm_polygons
#d4ac0d
1
landuse
recreation_ground
entertainment
osm_polygons
#f39c12
1
leisure
park
nature
osm_polygons
#abebc6
1
leisure
garden
nature
osm_polygons
#2ecc71
1
leisure
nature_reserve
nature
osm_polygons
#1d8348
1
natural
beach
nature
osm_polygons
#fcf3cf
1
natural
wood
nature
osm_polygons
#186a3b
1
natural
grassland
nature
osm_polygons
#bef5af
1
natural
sand
nature
osm_polygons
#f5edc5
1
natural
wetland
nature
osm_polygons
#45ffe3
1
landuse
forest
nature
osm_polygons
#196f3d
1
landuse
grass
nature
osm_polygons
#2ecc71
1
landuse
greenfield
nature
osm_polygons
#82e0aa
1
natural
scrub
nature
osm_polygons
#cec127
1
natural
water
nature
osm_polygons
#4141ff
1
The considered OSM key-values are listed as a sub-sample of all available features detailed here:
To explore directly and interactively OpenStreetMap one can login at https://www.openstreetmap.org/ and then try and modify items to have all relative information displayed.
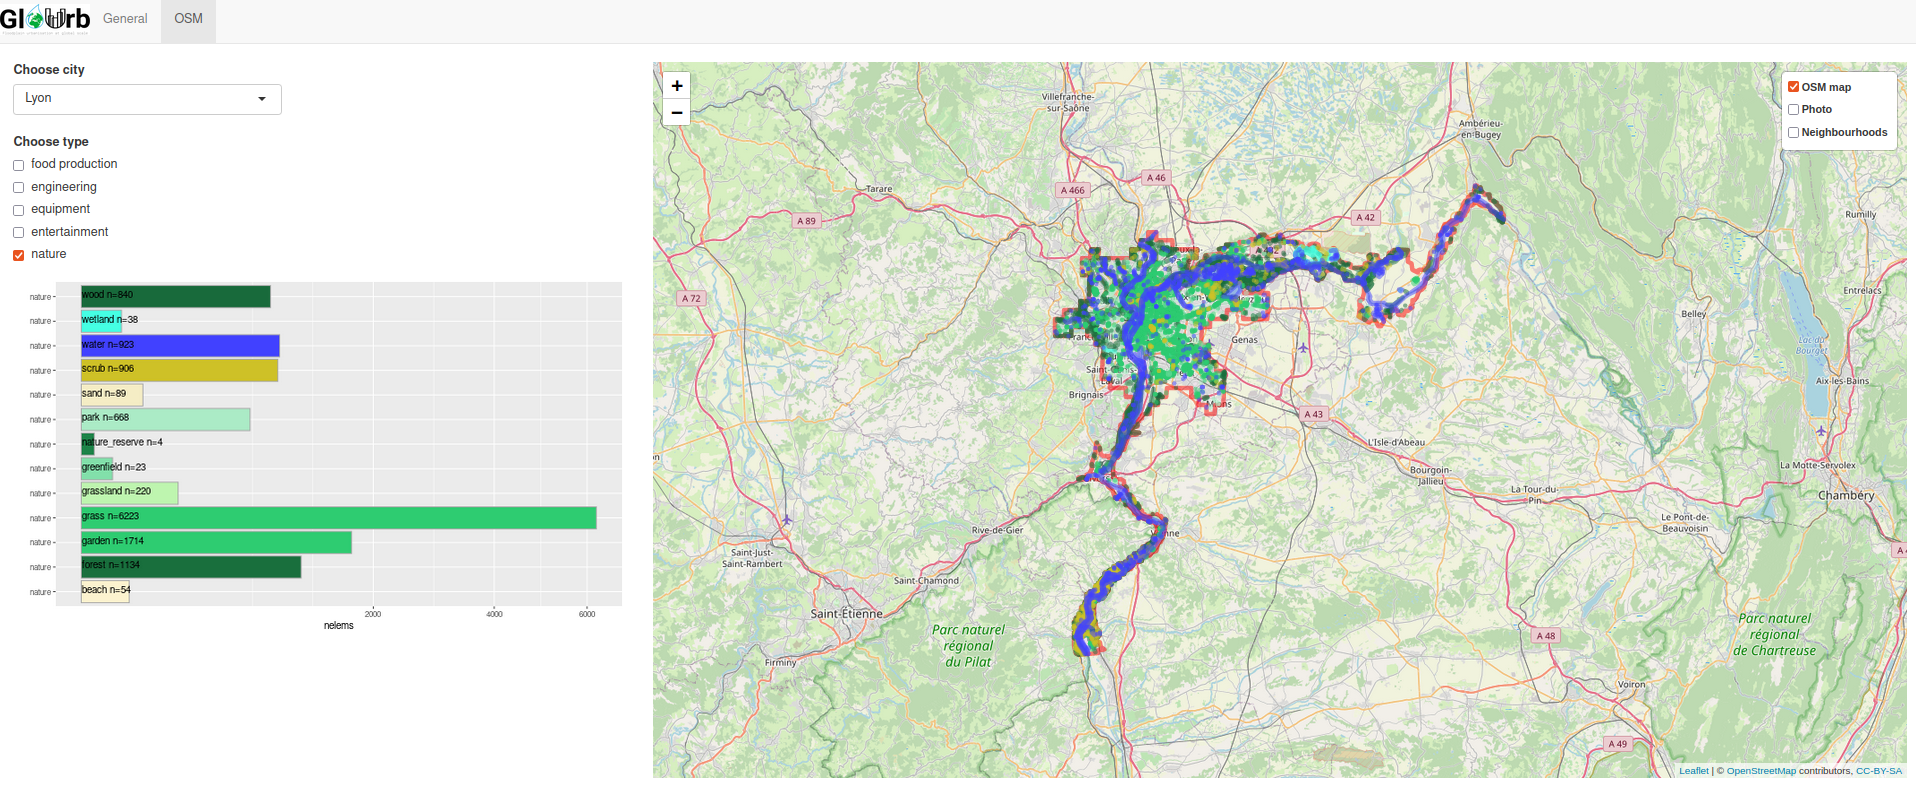
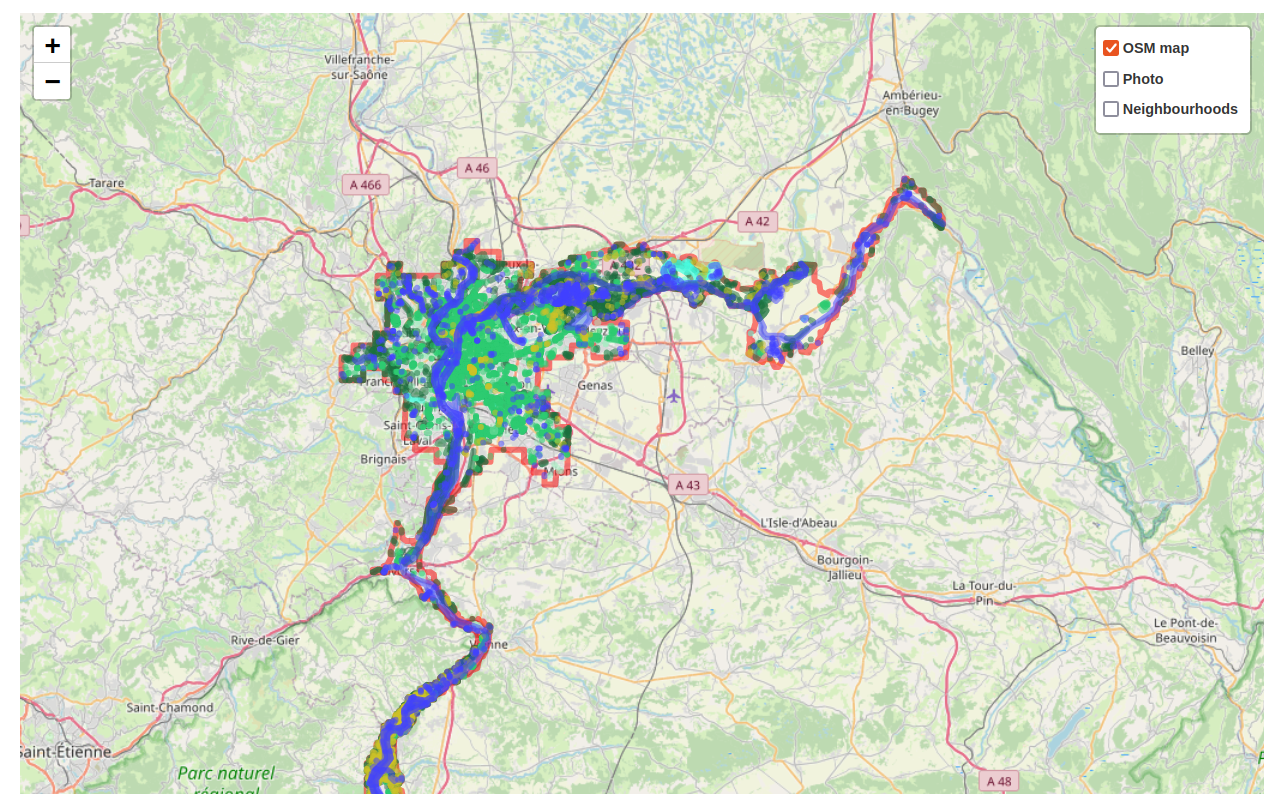
Here the map of Lyon with OSM basemap and layer regarding natural items
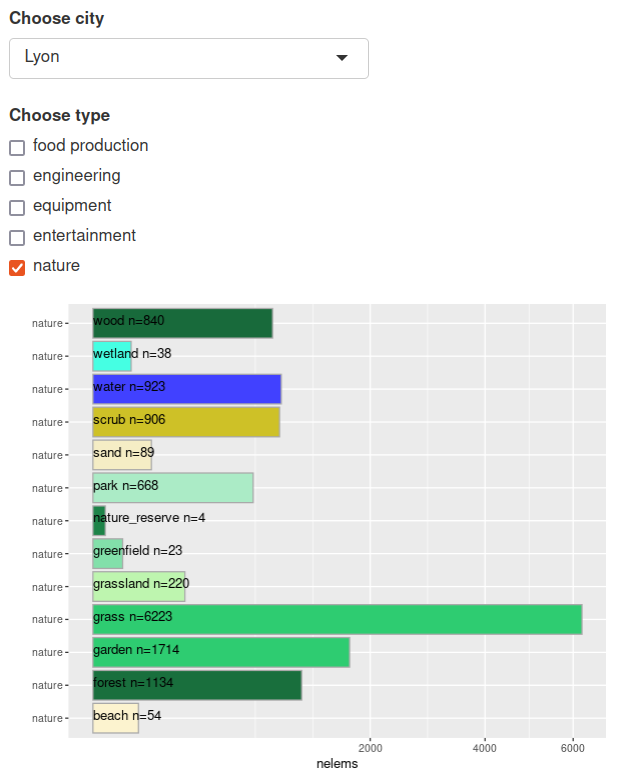
Different layers of information can be displayed on the map, according to some grouping defined in the tib_key_value table. The following plot displays the number of items corresponding to particular key-values in this group (several groups can be considered at once).
Dev notes
Packages
Several packages/workflows developed for project GloUrb:
[glourbi] package: provides plots and maps displayed in the first module of the app, consisting of a general description of N cities. Available here on github
[glosmurb] package: gathers functions that help collect OSM data for \(N_A\) cities. Available here on github
glosmurb_collect : an R workflow that uses glosmurb to actually collect OSM data for the currently selected cities. Available here on github
[glourbapp] package: the shiny package using glourbi (first module) and glosmurb-collected data (second module). Available here on github
Data collection
To collect OSM data, the glosmurb_collect workflow has to be run again:
in case the table tib_key_value.csv (in [glosmurb]) is modified, i.e. new key-values are added or any other parameter (group, color, geometry considered) is modified. For now tib_key_value is loaded as a dataset provided by package [glosmurb]. Running the glosmurb_collect workflow with a new tib_key_value dataset will update the contents of the table map_elems_global (listing all area-key-value number of elements) and inst/mapinfo directory (with one city=one file containing these elements).
in case new cities are added or the shapefiles for previously considered cities are modified. In that case running the glosmurb_collect workflow will provide new or modified files to add to the app’s inst/shapes directory
To update the [glourbapp] package then data-raw/get_map_elems_global.R must be re-run before re-building the package.